In section 5- USE A NEW SHEET OF PAPER Write todays date and title Graphic Sources
Directions:
1. Read the scenario listed below with your team, then decide what is the BEST graphic sources to use to show the information in the best way.
2. Choose ONE of the following: diagram, table, bar graph, map, pie chart or web.
3. With your team, actually CREATE the source using data from your table. Each student will have to create this in their notes for class participation grade.
SCENARIOS
1: Choose ONE of the following: diagram, table, bar graph, map, pie chart or web.
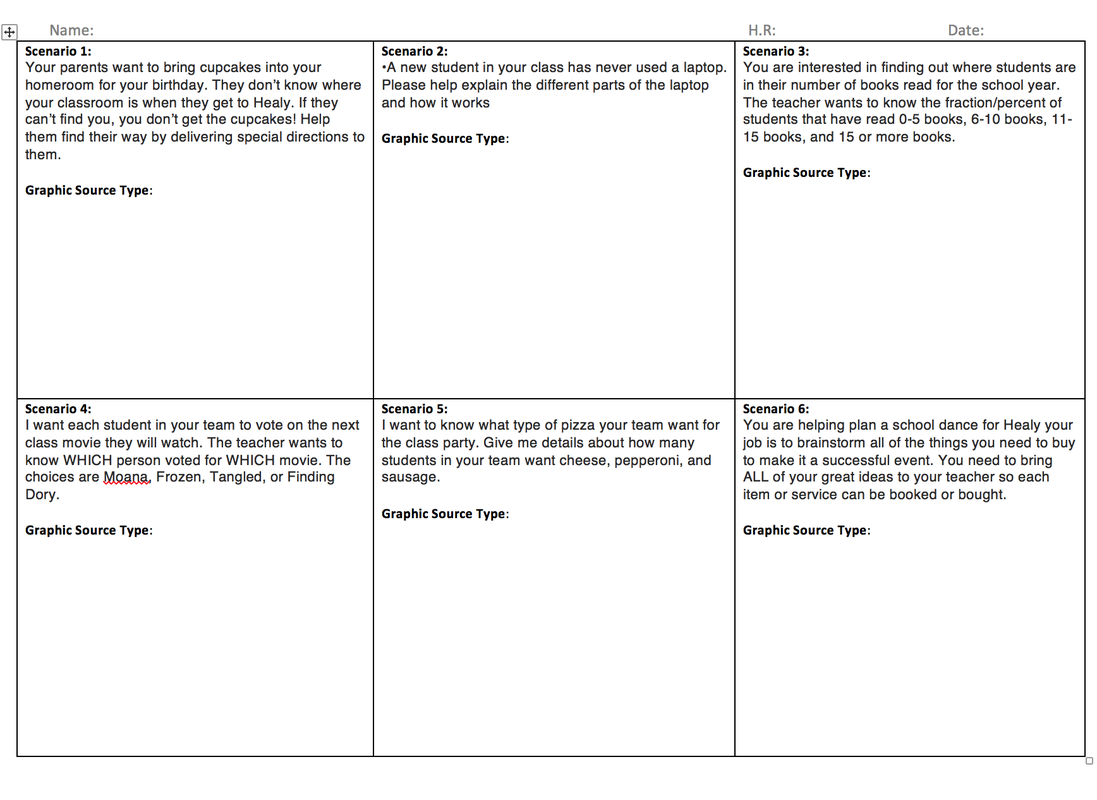
•Your parents want to bring cupcakes into your homeroom for your birthday. They don’t know where your classroom is when they get to Healy. If they can’t find you, you don’t get the cupcakes! Help them find their way by delivering special directions to them.
2: Choose ONE of the following: diagram, table, bar graph, map, pie chart or web.
•A new student in your class has never used a laptop. Please help explain the different parts of the laptop and how it works.
3: Choose ONE of the following: diagram, table, bar graph, map, pie chart or web.
•You are interested in finding out where students are in their number of books read for the school year. The teacher wants to know the fraction/percent of students that have read 0-5 books, 6-10 books, 11-15 books, and 15 or more books. **USE YOUR TEAM DATA TO CREATE ACTUAL GRAPHIC SOURCE**
4: Choose ONE of the following: diagram, table, bar graph, map, pie chart or web.
•I want each student in your team to vote on the next class movie they will watch. The teacher wants to know WHICH person voted for WHICH movie. The choices are Moana, Frozen, Tangled, or Finding Dory. ***HAVE YOUR ACTUAL TEAM VOTE ON THEIR MOVIE OF CHOICE**
5: Choose ONE of the following: diagram, table, bar graph, map, pie chart or web.
•I want to know what type of pizza your team want for the class party. Give me details about how many students in your team want cheese, pepperoni, and sausage.
6: Choose ONE of the following: diagram, table, bar graph, map, pie chart or web.
•You are helping plan a school dance for Healy your job is to brainstorm all of the things you need to buy to make it a successful event. You need to bring ALL of your great ideas to your teacher so each item or service can be booked or bought.
EXTRA CREDIT: COMPLETE THE CHART BELOW AND TURN IN TO TEACHER
Directions:
1. Read the scenario listed below with your team, then decide what is the BEST graphic sources to use to show the information in the best way.
2. Choose ONE of the following: diagram, table, bar graph, map, pie chart or web.
3. With your team, actually CREATE the source using data from your table. Each student will have to create this in their notes for class participation grade.
SCENARIOS
1: Choose ONE of the following: diagram, table, bar graph, map, pie chart or web.
•Your parents want to bring cupcakes into your homeroom for your birthday. They don’t know where your classroom is when they get to Healy. If they can’t find you, you don’t get the cupcakes! Help them find their way by delivering special directions to them.
2: Choose ONE of the following: diagram, table, bar graph, map, pie chart or web.
•A new student in your class has never used a laptop. Please help explain the different parts of the laptop and how it works.
3: Choose ONE of the following: diagram, table, bar graph, map, pie chart or web.
•You are interested in finding out where students are in their number of books read for the school year. The teacher wants to know the fraction/percent of students that have read 0-5 books, 6-10 books, 11-15 books, and 15 or more books. **USE YOUR TEAM DATA TO CREATE ACTUAL GRAPHIC SOURCE**
4: Choose ONE of the following: diagram, table, bar graph, map, pie chart or web.
•I want each student in your team to vote on the next class movie they will watch. The teacher wants to know WHICH person voted for WHICH movie. The choices are Moana, Frozen, Tangled, or Finding Dory. ***HAVE YOUR ACTUAL TEAM VOTE ON THEIR MOVIE OF CHOICE**
5: Choose ONE of the following: diagram, table, bar graph, map, pie chart or web.
•I want to know what type of pizza your team want for the class party. Give me details about how many students in your team want cheese, pepperoni, and sausage.
6: Choose ONE of the following: diagram, table, bar graph, map, pie chart or web.
•You are helping plan a school dance for Healy your job is to brainstorm all of the things you need to buy to make it a successful event. You need to bring ALL of your great ideas to your teacher so each item or service can be booked or bought.
EXTRA CREDIT: COMPLETE THE CHART BELOW AND TURN IN TO TEACHER